Apartment Pointer
Quick Web App built to pinpoint multiple locations on a given map, created mainly to make apartment hunting easier for myself.
Disclaimer: Please Read About Code Projects in the Finechive for more info.
Introduction
The following project is a simple web app that I created to pinpoint multiple locations on a map using Leaflet and OpenStreetMap address lookup. Initially designed with Scripting Shenanigans in mind, I ended up adding so much functionality to this simple script that I felt it warrants its own page here. I spent about an hour or so, most of which was me re-learning JavaScript to be able to code this thing out. Nevertheless, it did not take too long, and since it's not too long to warrant its own GitHub repository, I thought of dumping the code here and also walking through the same.
There are mainly two files: a HTML/CSS one, and a plain JavaScript one.
Code
HTML and CSS
aptPoint.html
The HTML Part of the app is not too long, but I will separate the CSS and HTML bits. The main app is just a quick form + a map container:
<!DOCTYPE html>
<html lang="en">
<head>
    <meta charset="UTF-8">
    <meta name="viewport" content="width=device-width, initial-scale=1.0">
    <title>Apartment Pointer</title>
    <!-- Leaflet CSS -->
    <link rel="stylesheet" href="https://unpkg.com/leaflet@1.9.4/dist/leaflet.css"
    integrity="sha256-p4NxAoJBhIIN+hmNHrzRCf9tD/miZyoHS5obTRR9BMY="
    crossorigin=""/>
    <!-- Leaflet JavaScript -->
    <script src="https://unpkg.com/leaflet@1.9.4/dist/leaflet.js"
    integrity="sha256-20nQCchB9co0qIjJZRGuk2/Z9VM+kNiyxNV1lvTlZBo="
    crossorigin=""></script>
</head>
These files in <head> were provided by Leaflet's Documentation.
Continuing:
<body>
    <div id="mapContainer">
        <div id="map"></div>
    </div>
    <div id="content">
        <div id="header">
            <h1>Apartment Pointer</h1>
        </div>
        <div id="mapForms">
            <label for="address">Address:</label>
            <input type="text" id="address" name="address"><br>
            <label for="extraInfo">Hover info:</label>
            <textarea id="extraInfo" name="extraInfo" rows="4" cols="50"></textarea><br>
            <label for="pinColor">Pin Color:</label>
            <select name="pinColor" id="pinColor">
                <option value="red">Red</option>
                <option value="blue">Blue</option>
                <option value="green">Green</option>
                <option value="gold">Gold</option>
                <option value="orange">Orange</option>
                <option value="yellow">Yellow</option>
                <option value="violet">Violet</option>
                <option value="grey">Grey</option>
                <option value="black">Black</option>
            </select>
            <button type="button" onClick="startMap()">Pin on Map</button>
            <button type="button" onClick="getJSON()">Get JSON</button>
            <button type="button" onClick="putJSON()">Put JSON</button>
        </div>
        <div id="jsonDisplay">
            <label for="jsonTextBox">JSON Data:</label>
            <textarea id="jsonTextBox" name="jsonTextBox" rows="4" cols="50"></textarea>
            <p>Save this JSON Data somewhere else, paste it back here to plot it again. Created by <a href="https://skushagra.com/">Kush S.</a></p>
        </div>
    </div>
    <!-- Custom JavaScript -->
    <script src="./aptPoint.js"></script>
</body>
</html>
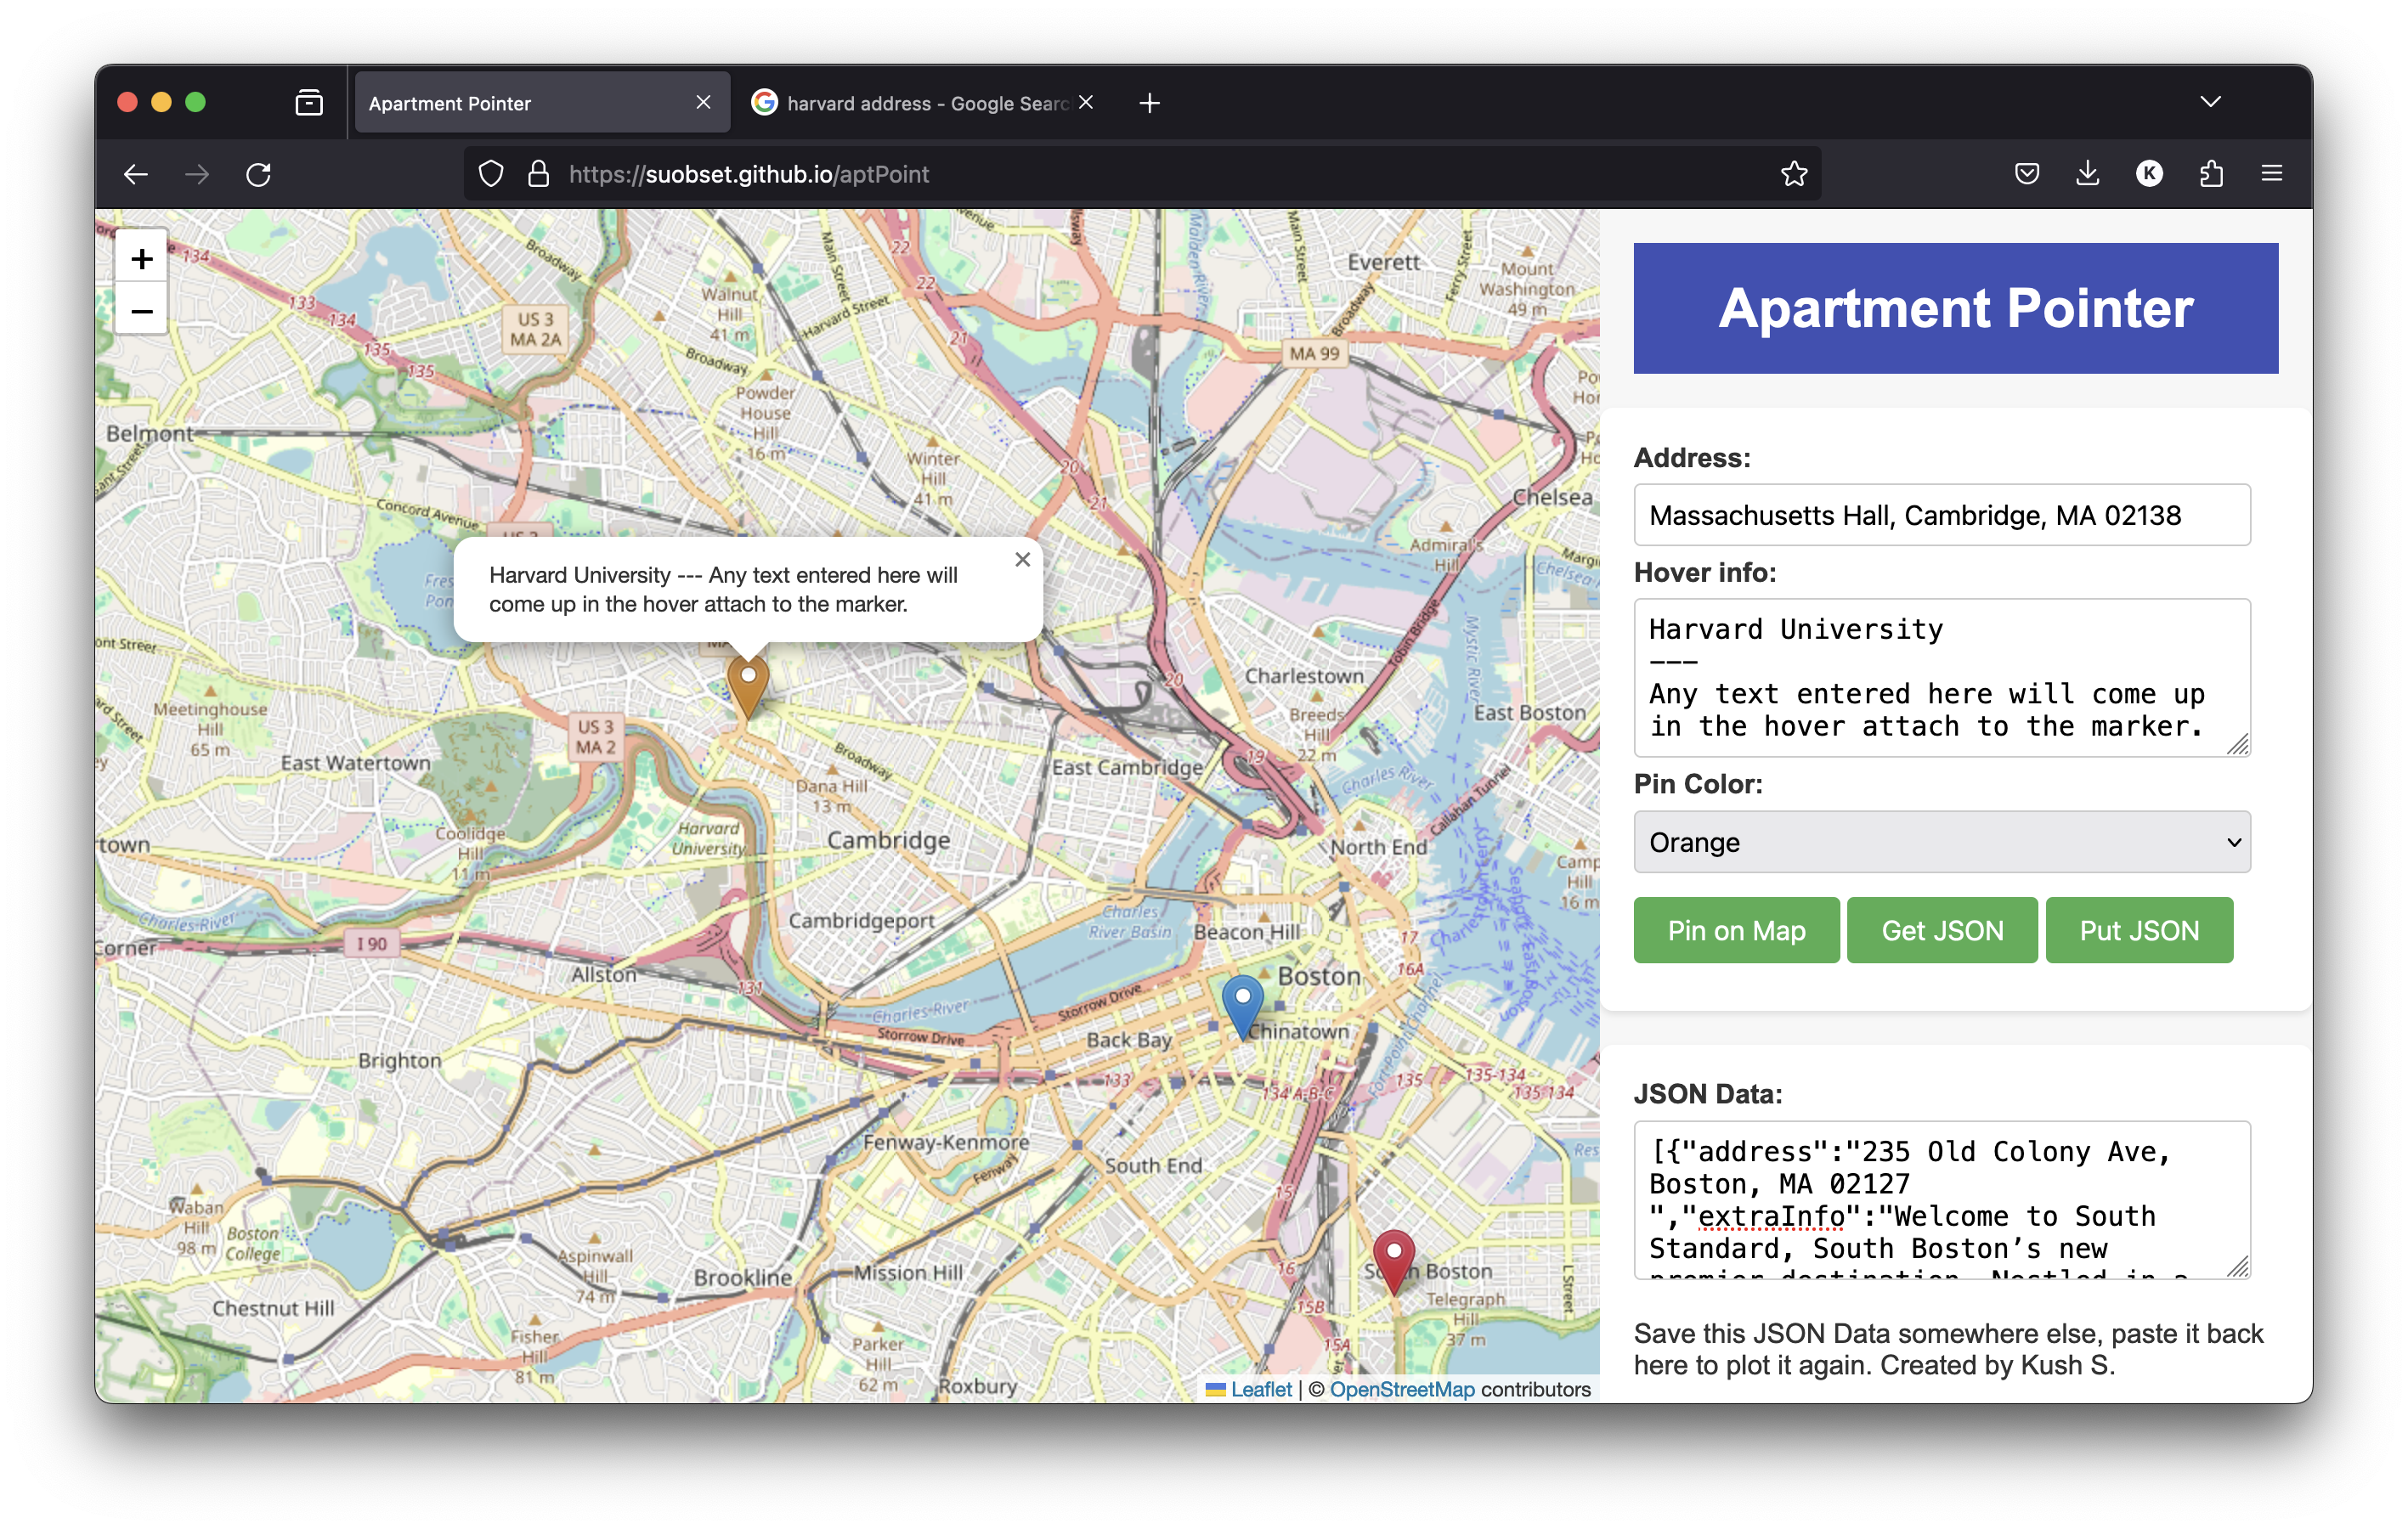
The main content is divided into two sections: a container for rendering the map and a section for user input and controls. The input section includes fields for entering an address, hover information, and selecting a pin color. There are buttons to pin the entered information on the map, retrieve JSON data, and store JSON data. A textarea displays the JSON data, which can be saved and loaded back into the application.
If we notice the CSS below, it can be seen that div mapContainer is given 70% width, and the content div for the form and user controls is given 30% width. Thus, these two divs consist of the main layout, and all other divs fill in the content div.
    body {
        font-family: Arial, sans-serif;
        margin: 0;
        padding: 0;
        background-color: #f7f7f7;
        color: #333;
        display: flex; /* Use flexbox for layout */
    }
    #header {
        background-color: #3f51b5;
        color: white;
        padding: 20px 0;
        text-align: center;
        width: 100%; /* Take full width */
    }
    h1 {
        margin: 0;
        font-size: 32px;
    }
    #content {
        display: flex;
        flex-direction: column;
        align-items: center;
        justify-content: center;
        width: 30%; /* Take half width */
        padding: 20px;
    }
    #mapContainer {
        width: 70%; /* Take half width */
        height: 100vh; /* Full height of the viewport */
        overflow: hidden; /* Hide overflow */
    }
    #map {
        height: 100%; /* Take full height of map container */
    }
    #mapForms {
        padding: 20px;
        background-color: #fff;
        margin-top: 20px;
        border-radius: 8px;
        box-shadow: 0 2px 4px rgba(0,0,0,0.1);
        width: 100%; /* Take full width */
    }
    label {
        font-weight: bold;
    }
    input, textarea, select {
        width: calc(100% - 16px);
        padding: 8px;
        margin: 6px 0;
        border: 1px solid #ccc;
        border-radius: 4px;
        box-sizing: border-box;
        font-size: 16px;
    }
    button {
        background-color: #4CAF50;
        color: white;
        padding: 10px 20px;
        margin: 8px 0;
        border: none;
        border-radius: 4px;
        cursor: pointer;
        font-size: 16px;
    }
    button:hover {
        background-color: #45a049;
    }
    #jsonDisplay {
        margin-top: 20px;
        background-color: #fff;
        padding: 20px;
        border-radius: 8px;
        box-shadow: 0 2px 4px rgba(0,0,0,0.1);
        width: 100%; /* Take full width */
    }
    #jsonTextBox {
        width: calc(100% - 16px);
    }
Where the main things to pay attention to are #mapContainer and #content, while the rest exist mainly for aesthetic purposes.
JavaScript
We begin aptPoint.js with loading files and declaring a Map object as noted in Leaflet documentation:
// Initialize the map: setView takes coordinates and a Zoom level
//for the initial Map
var map = L.map('map').setView([42.3601, -71.0589], 13);
// Add a tile layer
L.tileLayer('https://{s}.tile.openstreetmap.org/{z}/{x}/{y}.png', {
attribution: '© <a href="https://www.openstreetmap.org/copyright">OpenStreetMap</a> contributors'
}).addTo(map);
// Leaflet documentation code ends here
The main function here is startMap(). Upon a user filling out the form on the right, when the Pin on map button is clicked, it invokes the startMap() function. This function:
- Takes in Values for Address, any extra info needed to put in the Map Hover, and Pin Color
- Uses OpenStreetMap to geocode addresses to coordinates using the JS
fetch()API:- Raw debugging info can be looked up here
- Example debugging info for Lederle graduate Research Center at UMass Amherst.
- If fetch is successful:
- Plots corresponding marker on map, fetching different marker colors from this GitHub Repository
- Attaches a hover box with the data in the textarea, which can be seen when a user clicks on the marker.
- Pans the Map to the newly created Marker.
- Encodes Address, Extra Hover Info, and Pin Color to JSON and saves it for user downloading.
// Array to hold all JSON data for each marker
var mapDataJSONarr = [];
// Gather info and start pinning
var startMap = function() {
    var address = document.getElementById("address").value;
    var extraInfo = document.getElementById("extraInfo").value;
    var pinColor = document.getElementById("pinColor").value;
    console.log(address);
    console.log(extraInfo);
    console.log(pinColor);
    // Geocode address to coordinates
    var url = 'https://nominatim.openstreetmap.org/search?format=json&q=' + encodeURIComponent(address);
    fetch(url)
    .then(response => response.json())
    .then(data => {
        // Extract latitude and longitude from the response
        var latitude = data[0].lat;
        var longitude = data[0].lon;
        console.log("Latitude:", latitude);
        console.log("Longitude:", longitude);
        // Not me forgetting that these variables exist only in the context of this fetch
        // Custom icons: https://github.com/pointhi/leaflet-color-markers
        var iconURL = 'https://raw.githubusercontent.com/pointhi/leaflet-color-markers/master/img/marker-icon-2x-' + pinColor + '.png';
        var customIcon = new L.Icon({
            iconUrl: iconURL,
            shadowUrl: 'https://cdnjs.cloudflare.com/ajax/libs/leaflet/0.7.7/images/marker-shadow.png',
            iconSize: [25, 41],
            iconAnchor: [12, 41],
            popupAnchor: [1, -34],
            shadowSize: [41, 41]
        });
        var marker = L.marker([latitude, longitude], {icon: customIcon}).addTo(map);
        marker.bindPopup(extraInfo).openPopup();
        // Pan to the new marker
        map.panTo([latitude, longitude], 20);
        var thisJSON = {"address": address, "extraInfo": extraInfo, "pinColor": pinColor};
        mapDataJSONarr.push(JSON.stringify(thisJSON));
    })
    .catch(error => {
        console.error('Error fetching data:', error);
    });
};
Now, for the user to save JSOn data to their own computer, or for the user to plot back the JSON data already saved on their computer, we have some simple getter and setters:
// Fetch existing JSON data from map
var getJSON = function() {
    var jsonDiv = document.getElementById("jsonTextBox");
    jsonDiv.value += '[' + mapDataJSONarr + ']';
};

// Put new JSON Data on map
var putJSON = function(){
    var userJSON = document.getElementById("jsonTextBox").value;
    var userJSONArray = JSON.parse(userJSON)
    for(var i = 0; i < userJSONArray.length; ++i){
        document.getElementById("address").value = userJSONArray[i].address;
        document.getElementById("extraInfo").value = userJSONArray[i].extraInfo;
        document.getElementById("pinColor").value = userJSONArray[i].pinColor;
        startMap();
    }
}
getJSON() fetches the JSON Array and puts it in jsonTextBox, and putJSON() reads the JSON arr that the user puts in the same text box, and plots them on the map by auto-populating the forms and calling startMap()
This is how the basic map works. I will be adding more and more features that help me in my Apartment hunt, and will be updating this page accordingly.